2 minutes
Monitor synology storage metrics with prometheus
Most solutions that can be found on the Internet on the subject of ‘monitoring a Syno’ are based on SNMP. In contrast, you can install the corresponding node exporter on the Synology NAS in just a few steps and have Prometheus read it out.
Firstly, you should ensure that you have access to the NAS via SSH and that you have the appropriate rights using sudo -i.
Install node_exporter
After logging in, you should create a suitable directory, in this example we store all the required data/files under /volume1/monitoring/
mkdir -p /volume1/monitoring
cd /volume1/monitoring/
The latest release of node_exporter can alway s be found on GitHub
Get the latest release (e.g. 1.8.1 for linux amd64) and uncompress
cd /volume1/monitoring/
wget https://github.com/prometheus/node_exporter/releases/download/v1.8.1/node_exporter-1.8.1.linux-amd64.tar.gz
tar xvfz node_exporter-1.8.1.linux-amd64.tar.gz
now the folder node_exporter-1.8.1.linux-amd64 should exist. To simplify the handling of new versions (the path to the binary always remains the same), a corresponding symlink can be created
ln -s node_exporter-1.8.1.linux-amd64 node_exporter
Enable service node_exporter
To start node_exporter as service on boot, we can use the synology feature Triggered Task (you can find it under Control Panel –> Task Scheduler)
Click on Create –> Triggered Task –> User-defined script
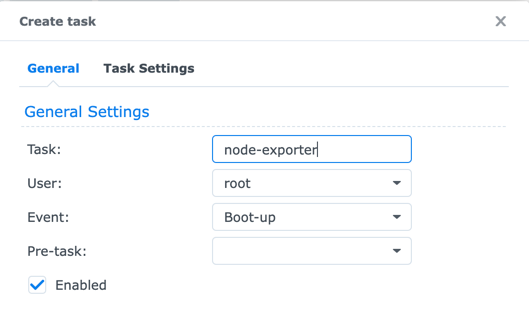
In the General choose a descriptive name for the task (e.g. node-exporter) and as Event choose Boot-up
next click on Task Settings and add the path to binary in User-defined script /volume1/monitoring/node_exporter/node_exporter
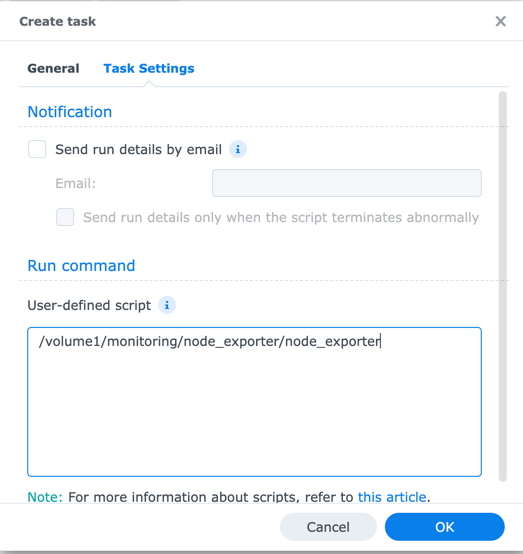
to save everything hit OK
Now select the newly created task and click Run to start the new service immediately.